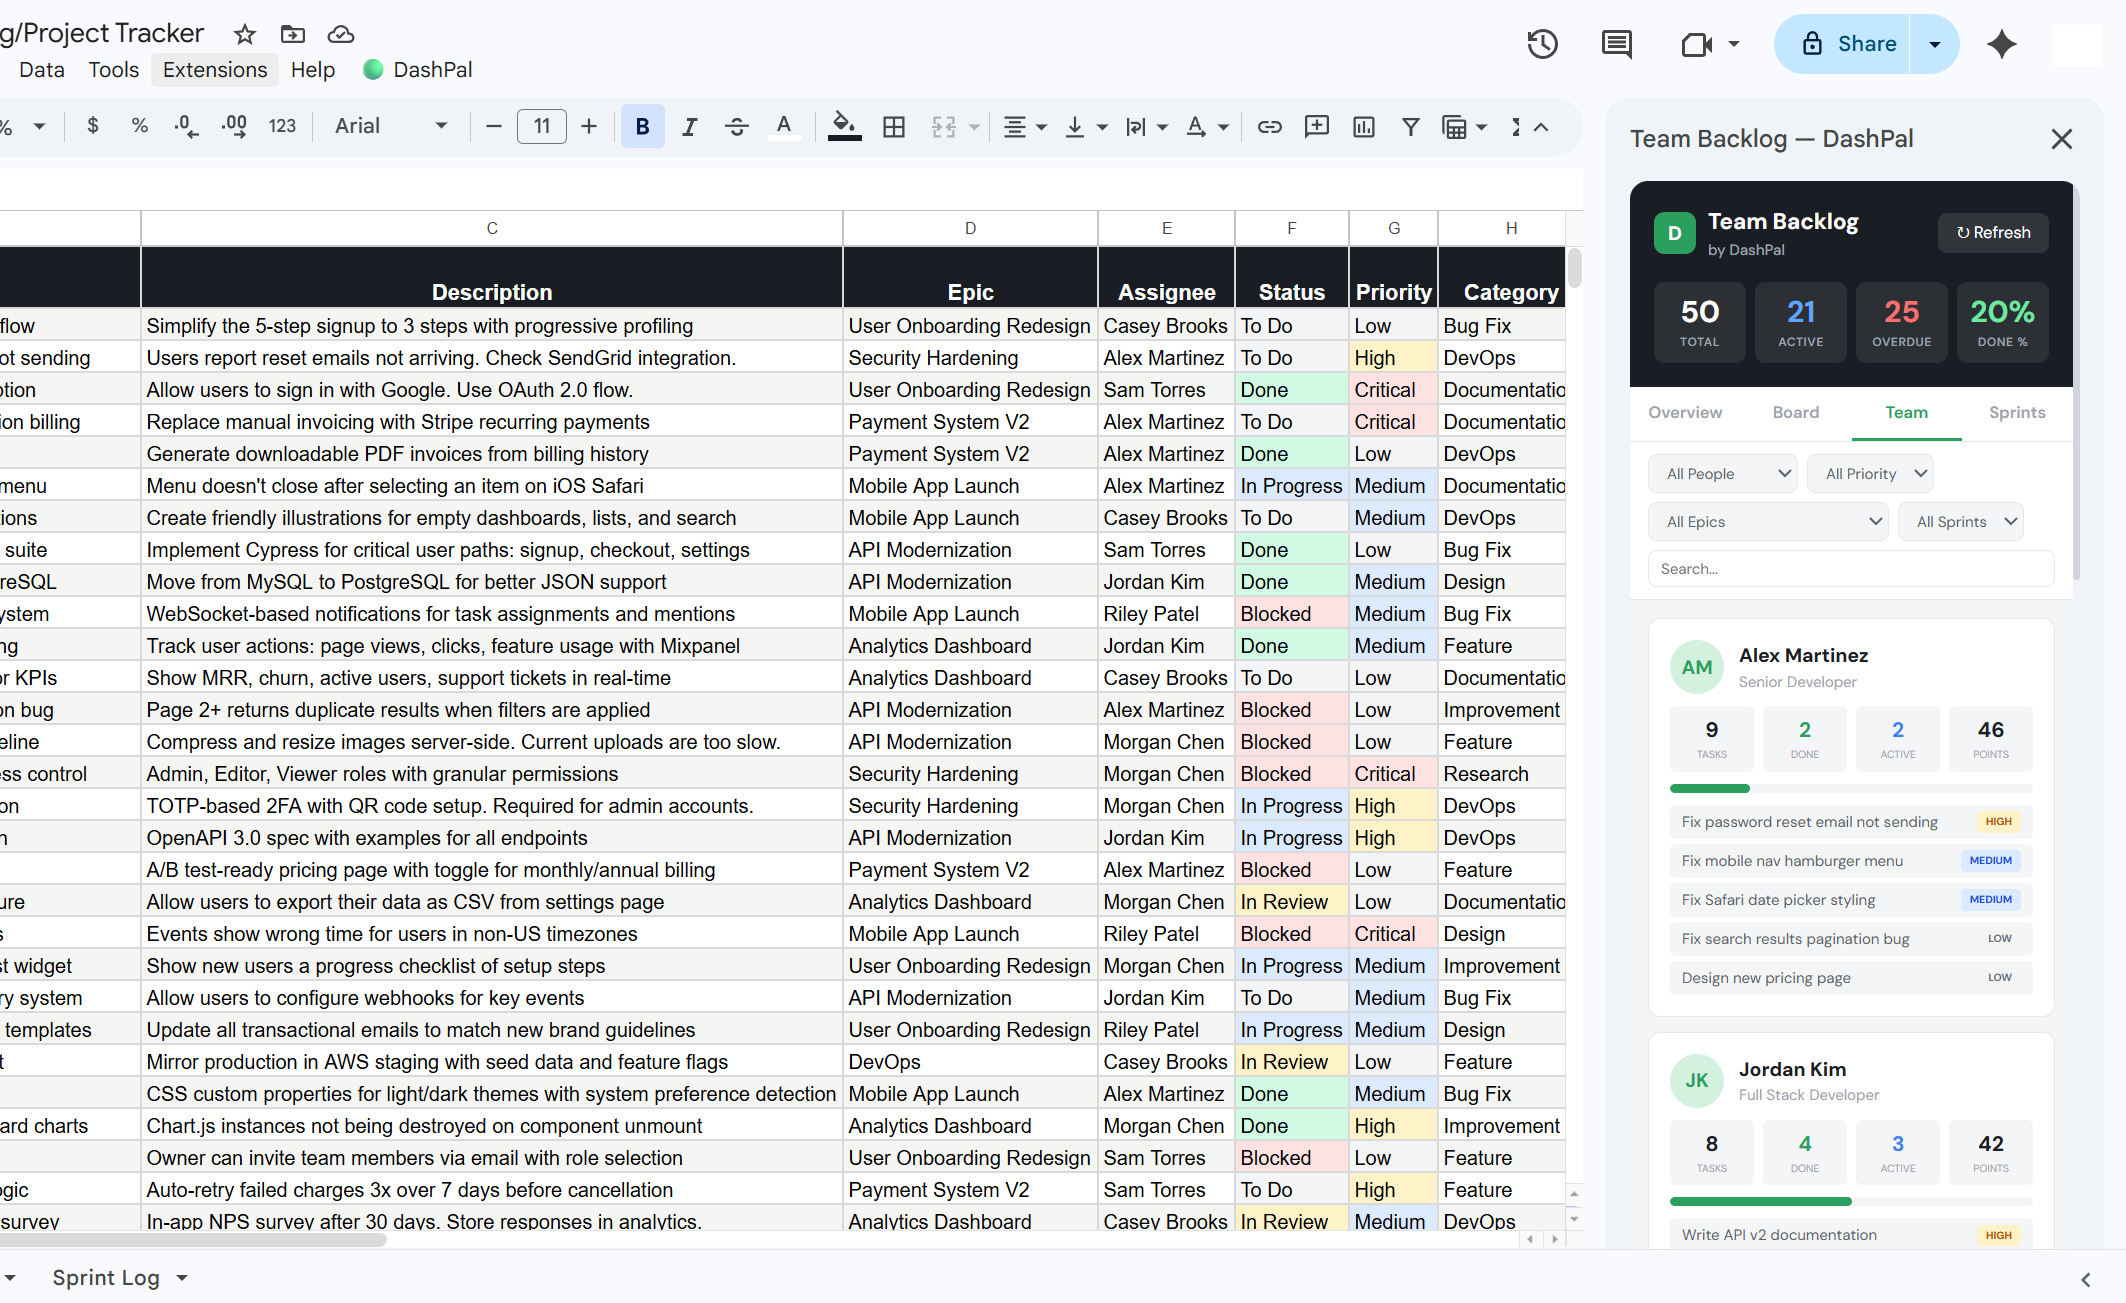
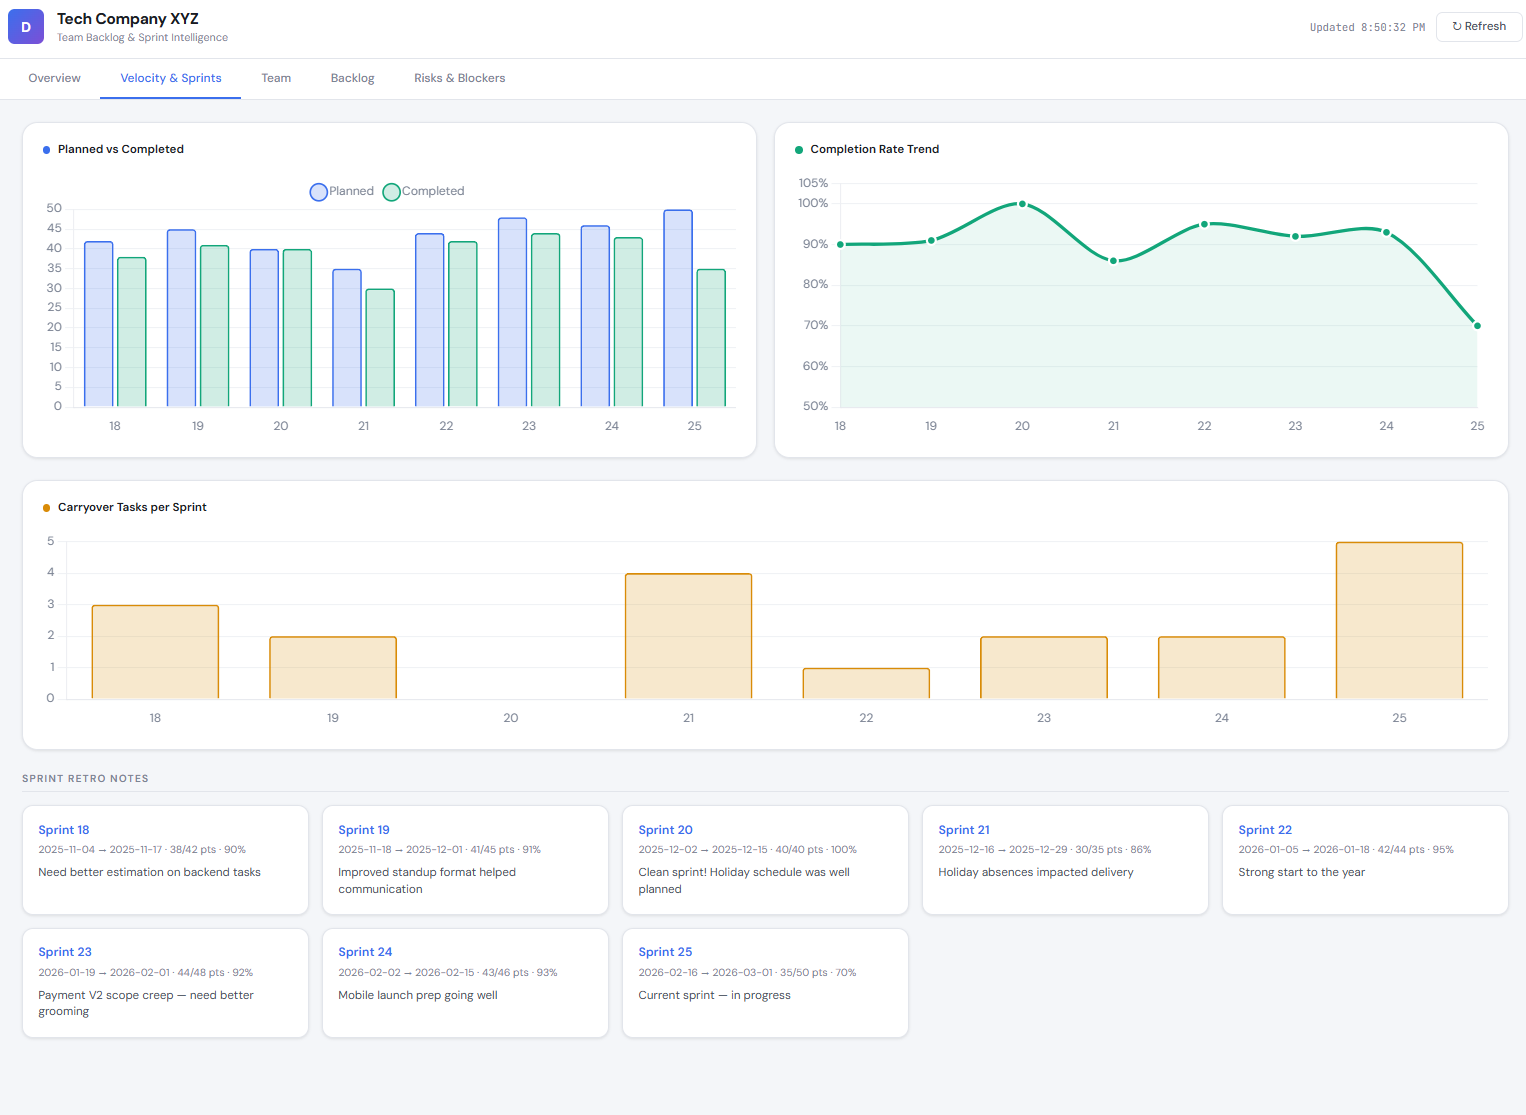
Interactive Team Backlog Web App
A complete project management web application powered by a Google Sheet. Track 50+ tasks across 6 team members with multi-view navigation — Overview, Velocity & Sprints, Team, Backlog, and Risks & Blockers.
Before & After
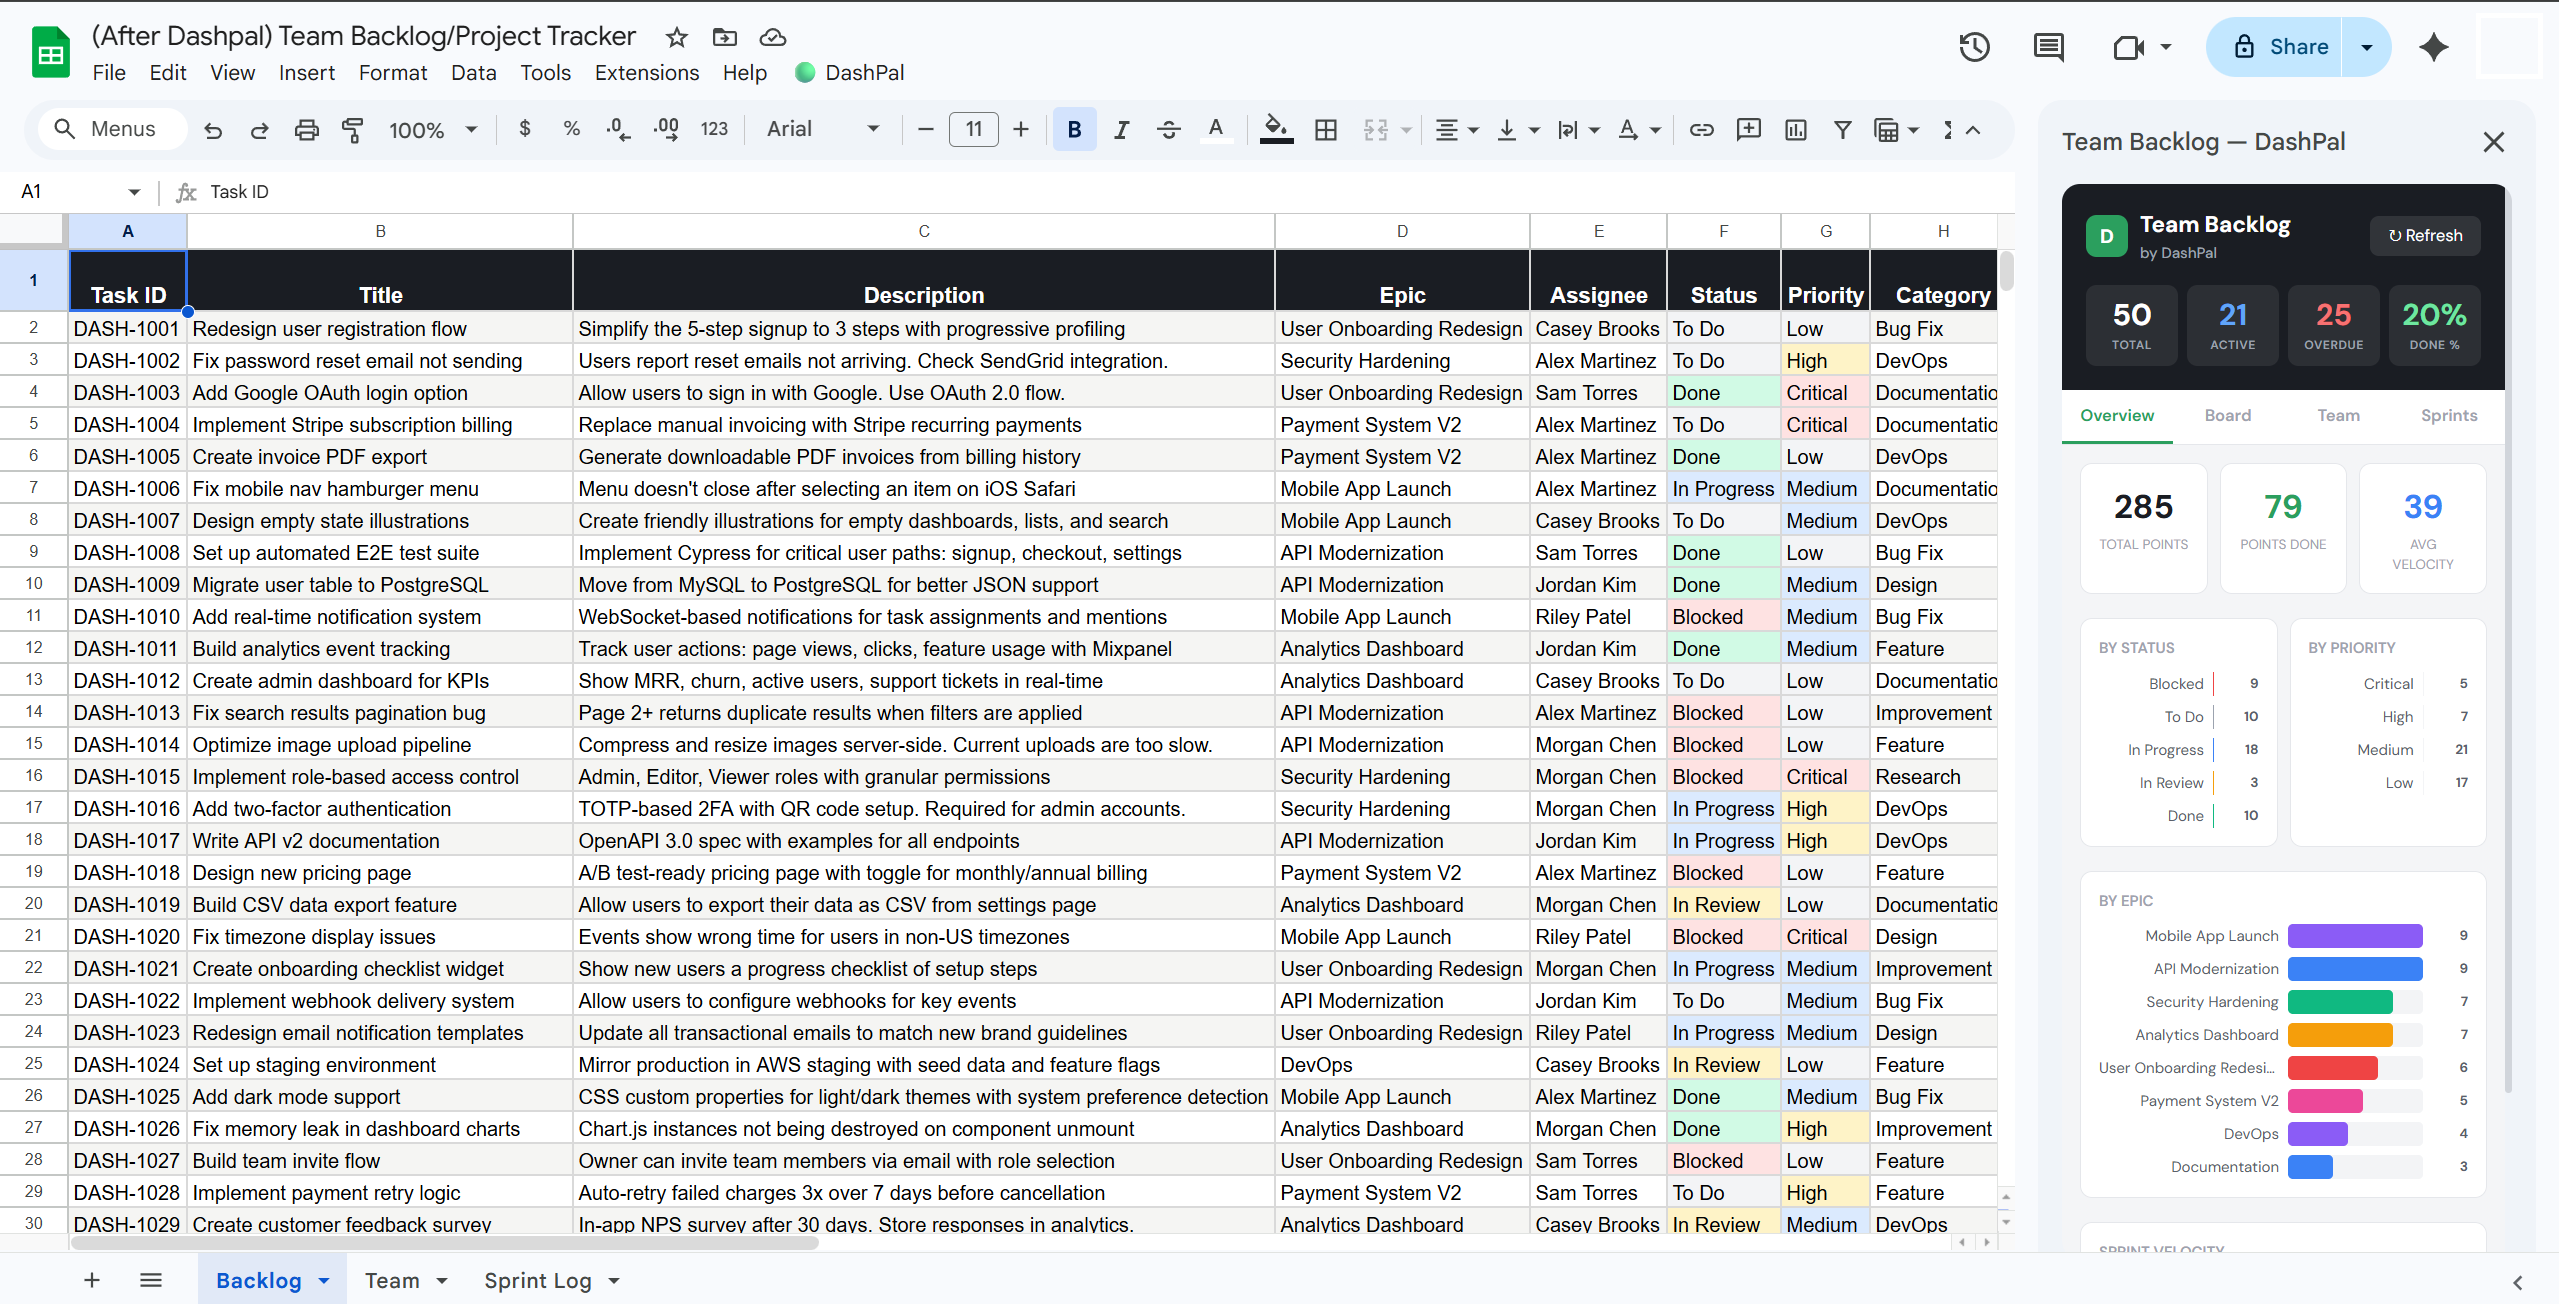
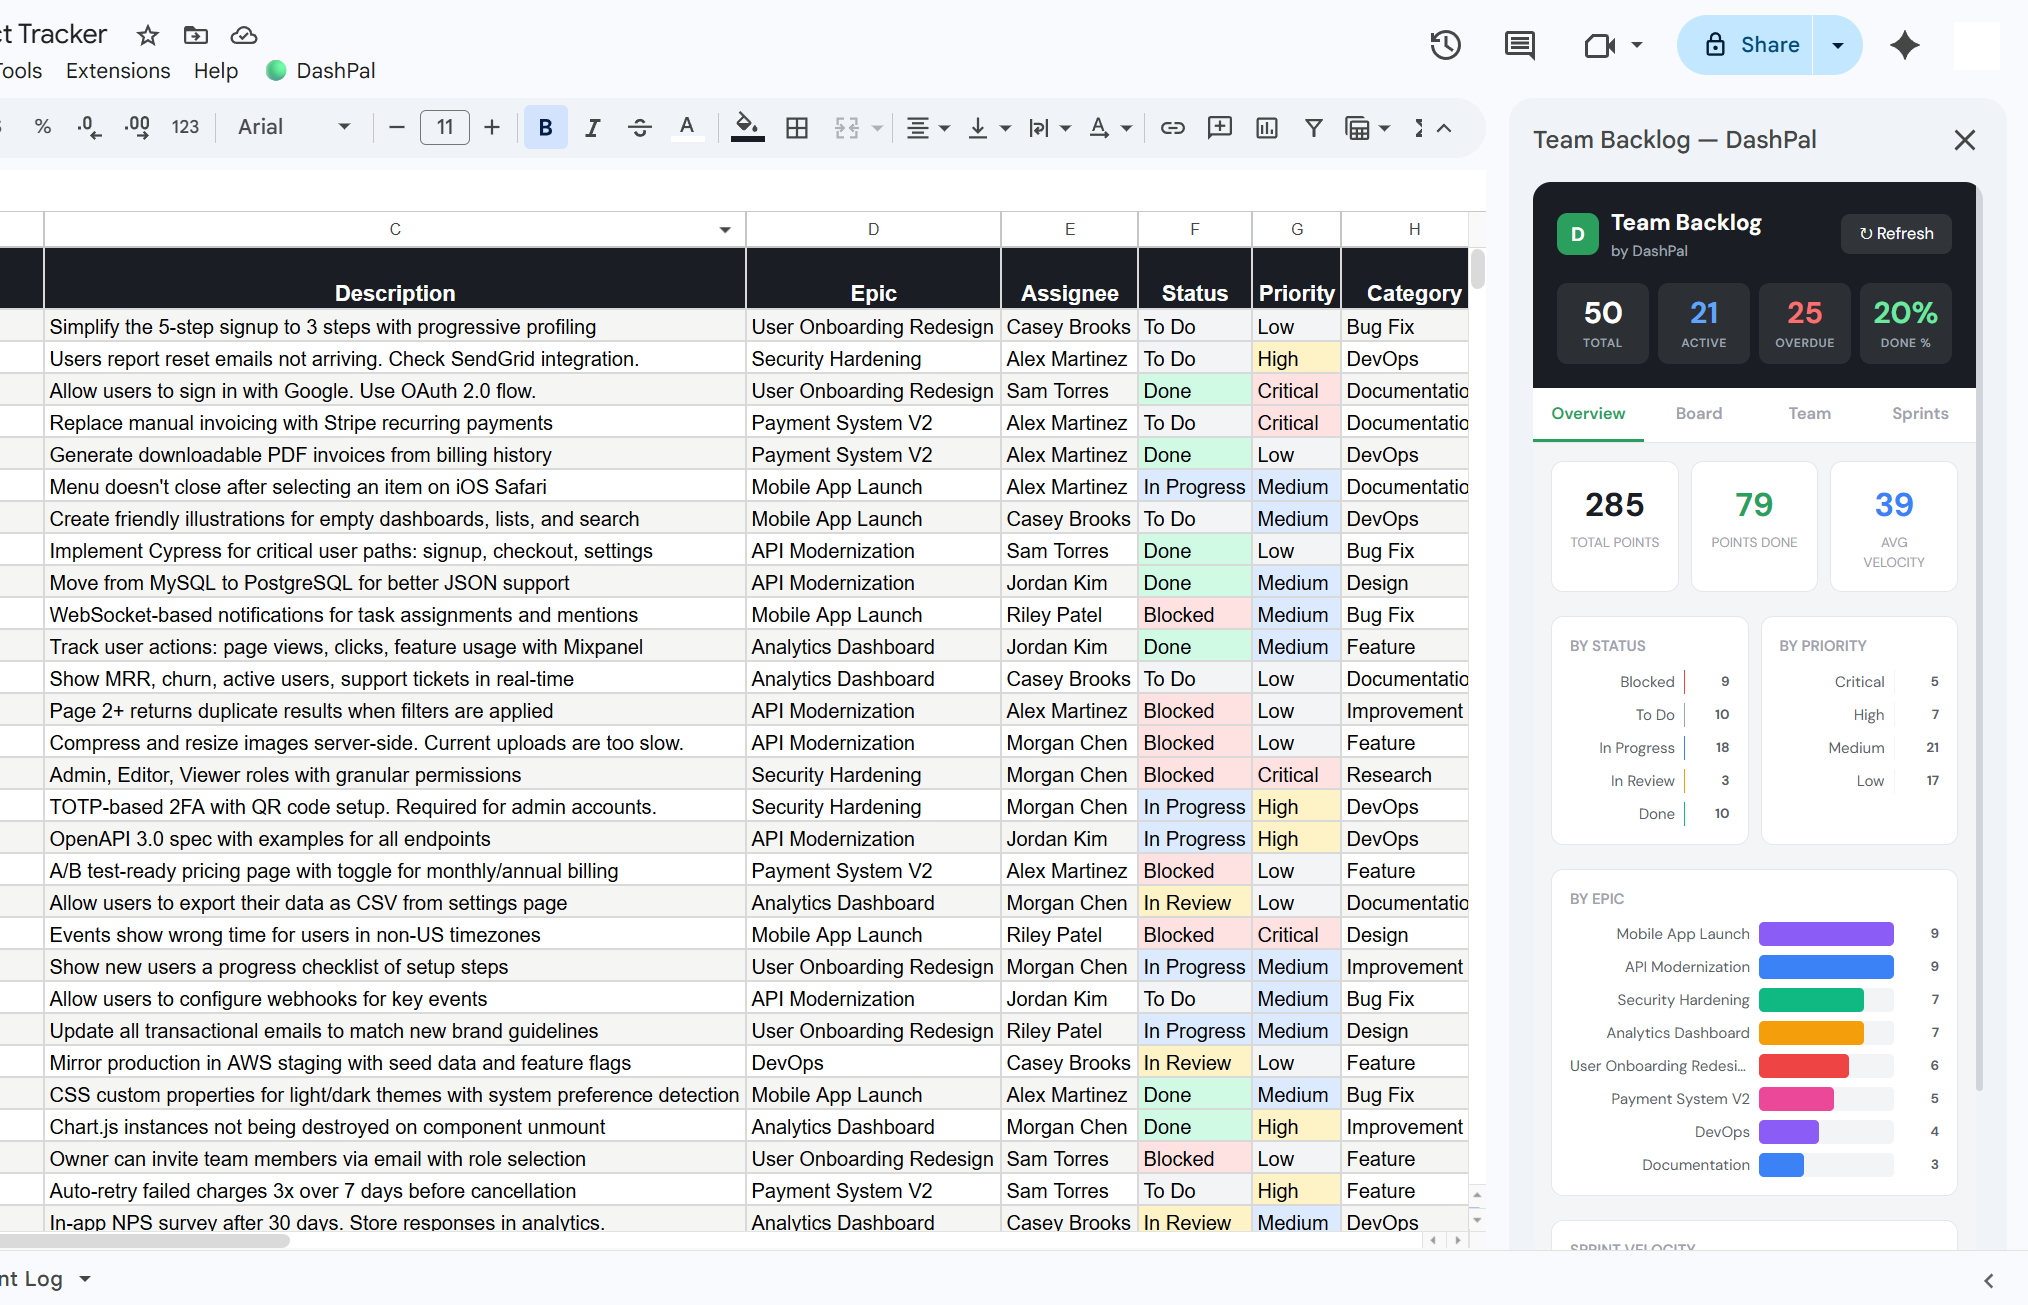
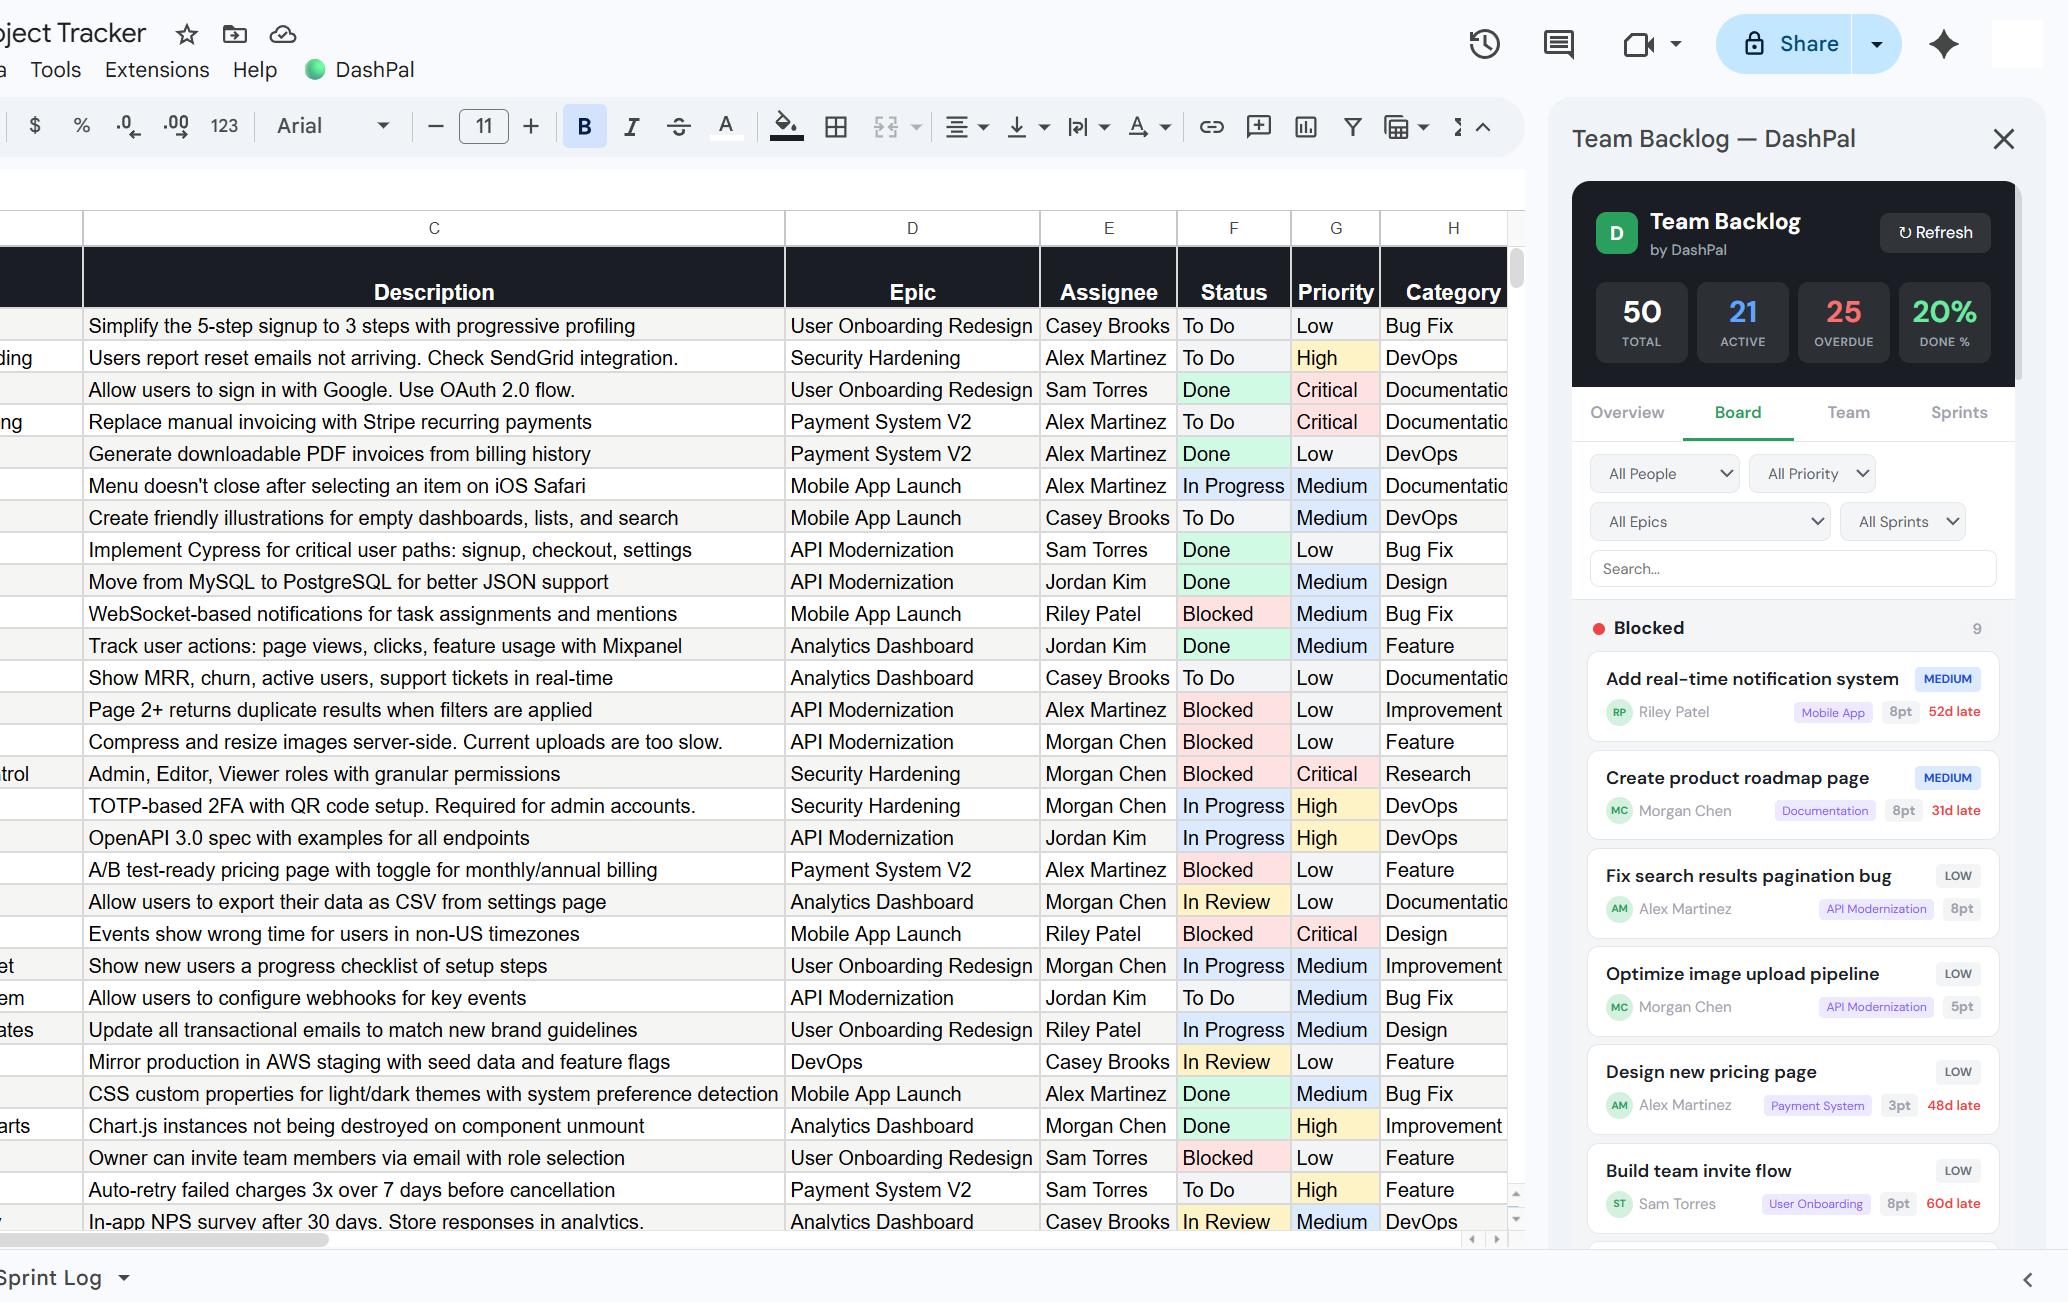
Explore the Views
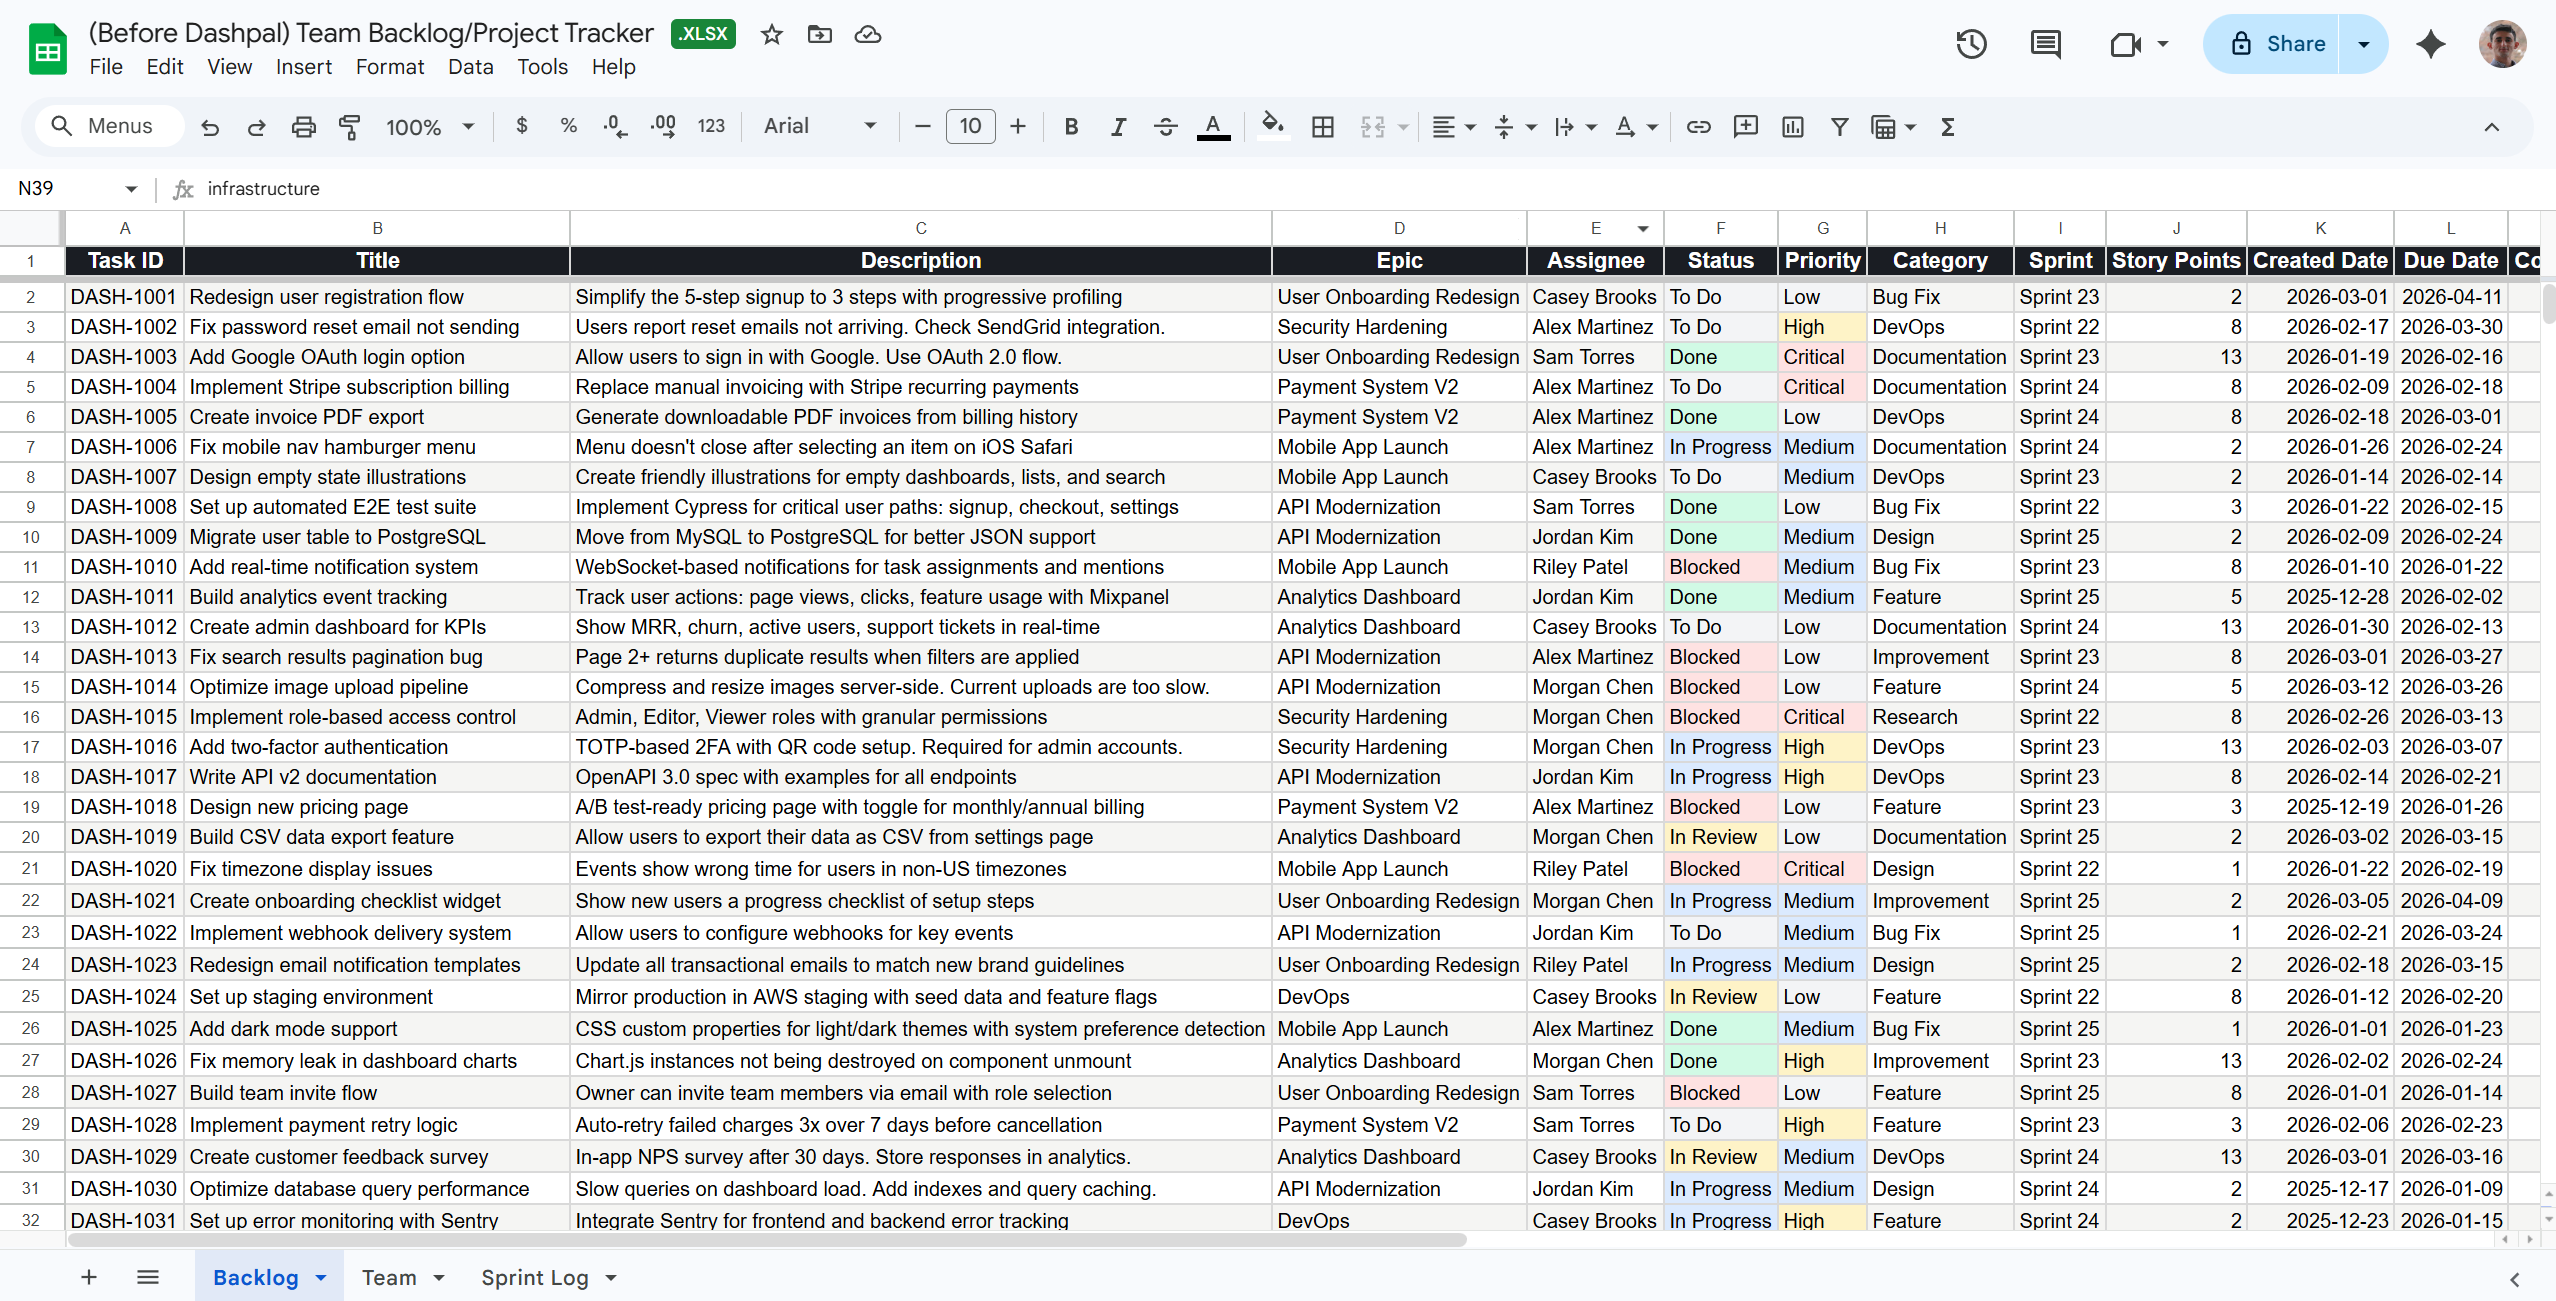
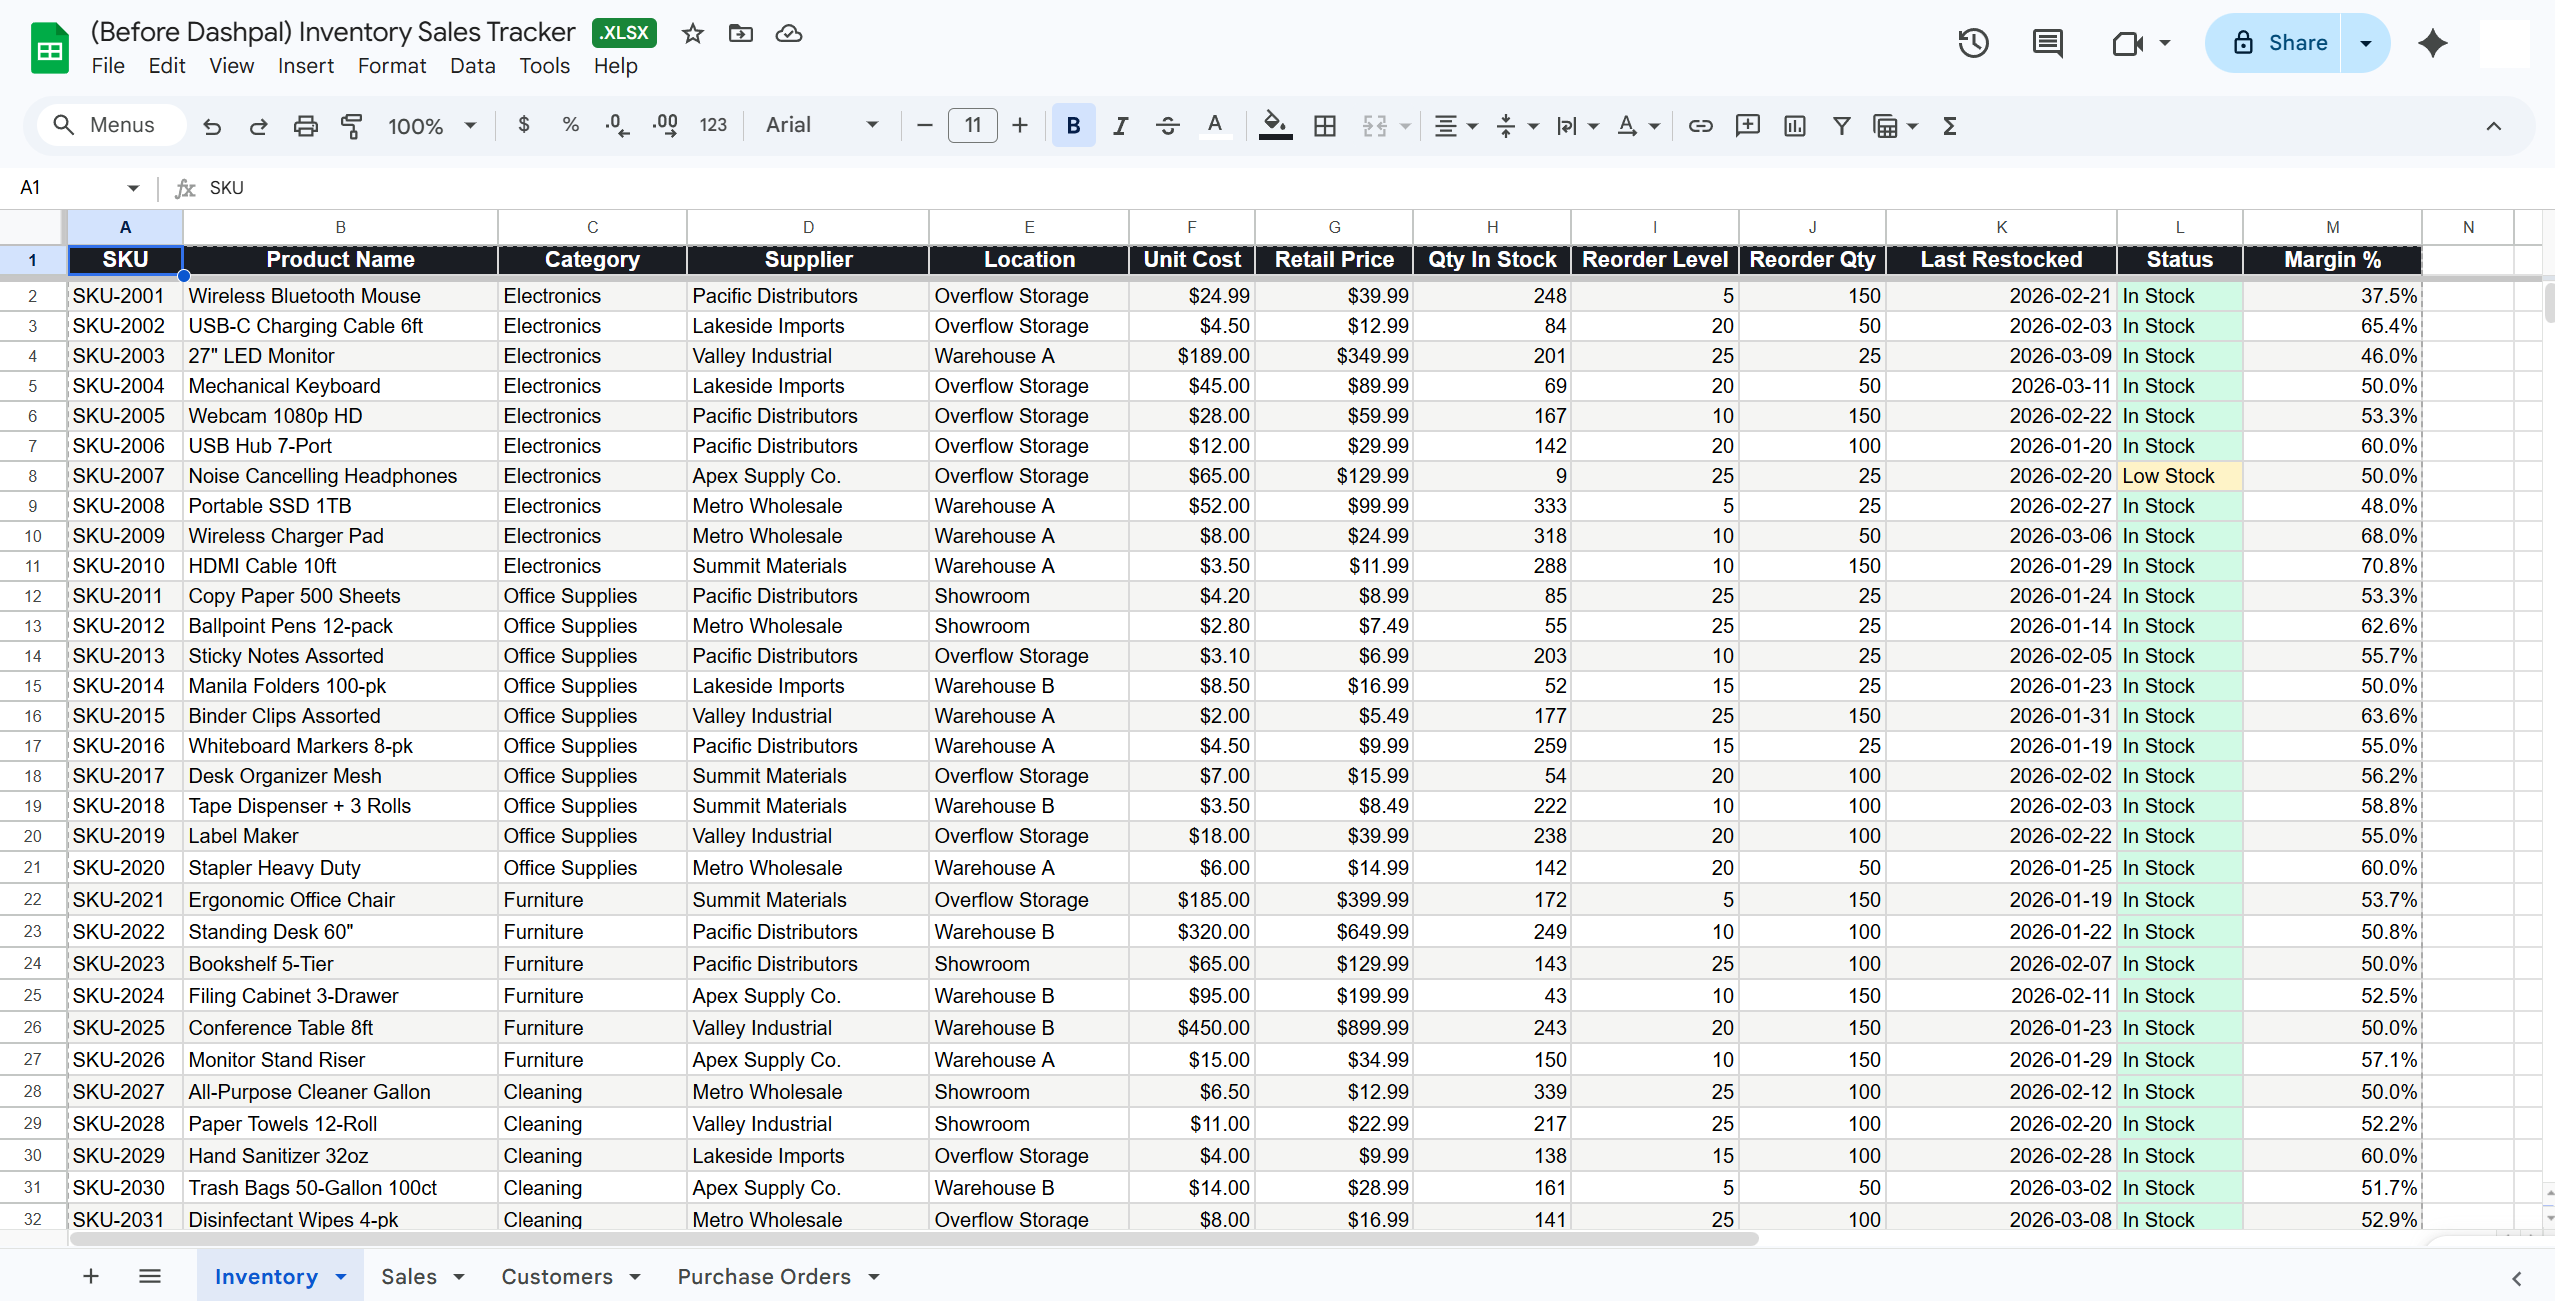
Want to see what it looked like before? Open the original raw Google Sheet this app was built on.
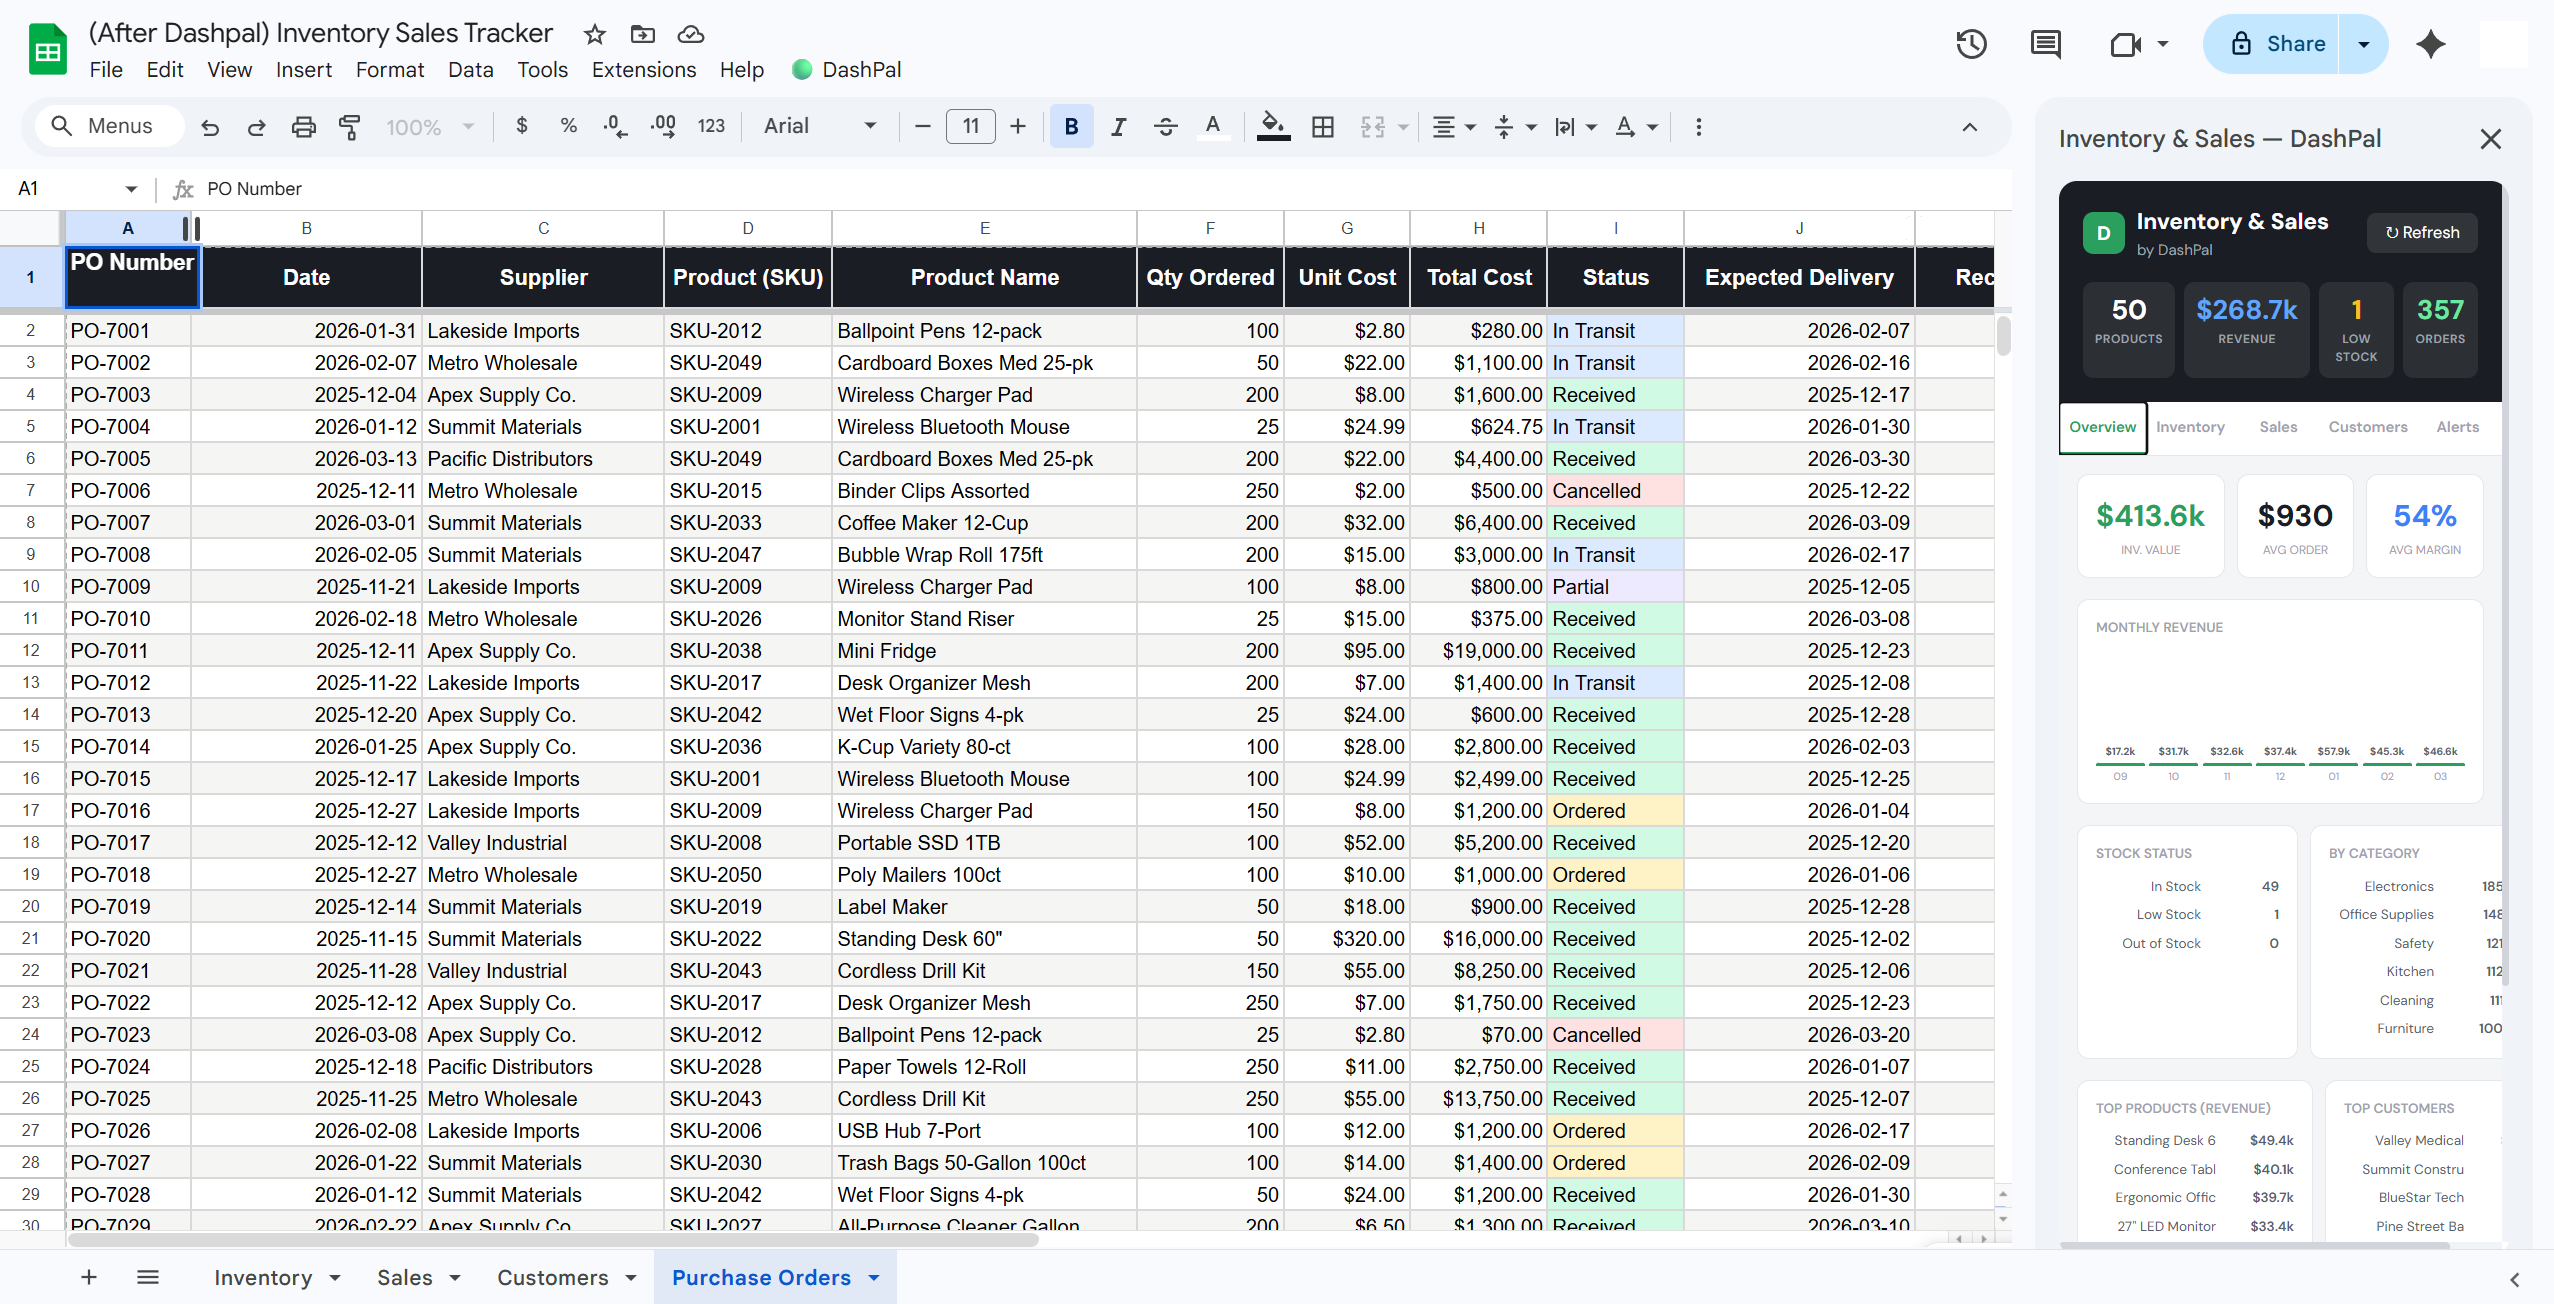
📋 View Raw SheetInventory & Sales Intelligence Web App
A comprehensive business web application with 5-tab navigation — Overview, Inventory, Sales, Customers, and Supply Chain. Revenue charts, stock breakdowns, order browsers, customer rankings, and real-time KPI cards.
Before & After
Explore the Views
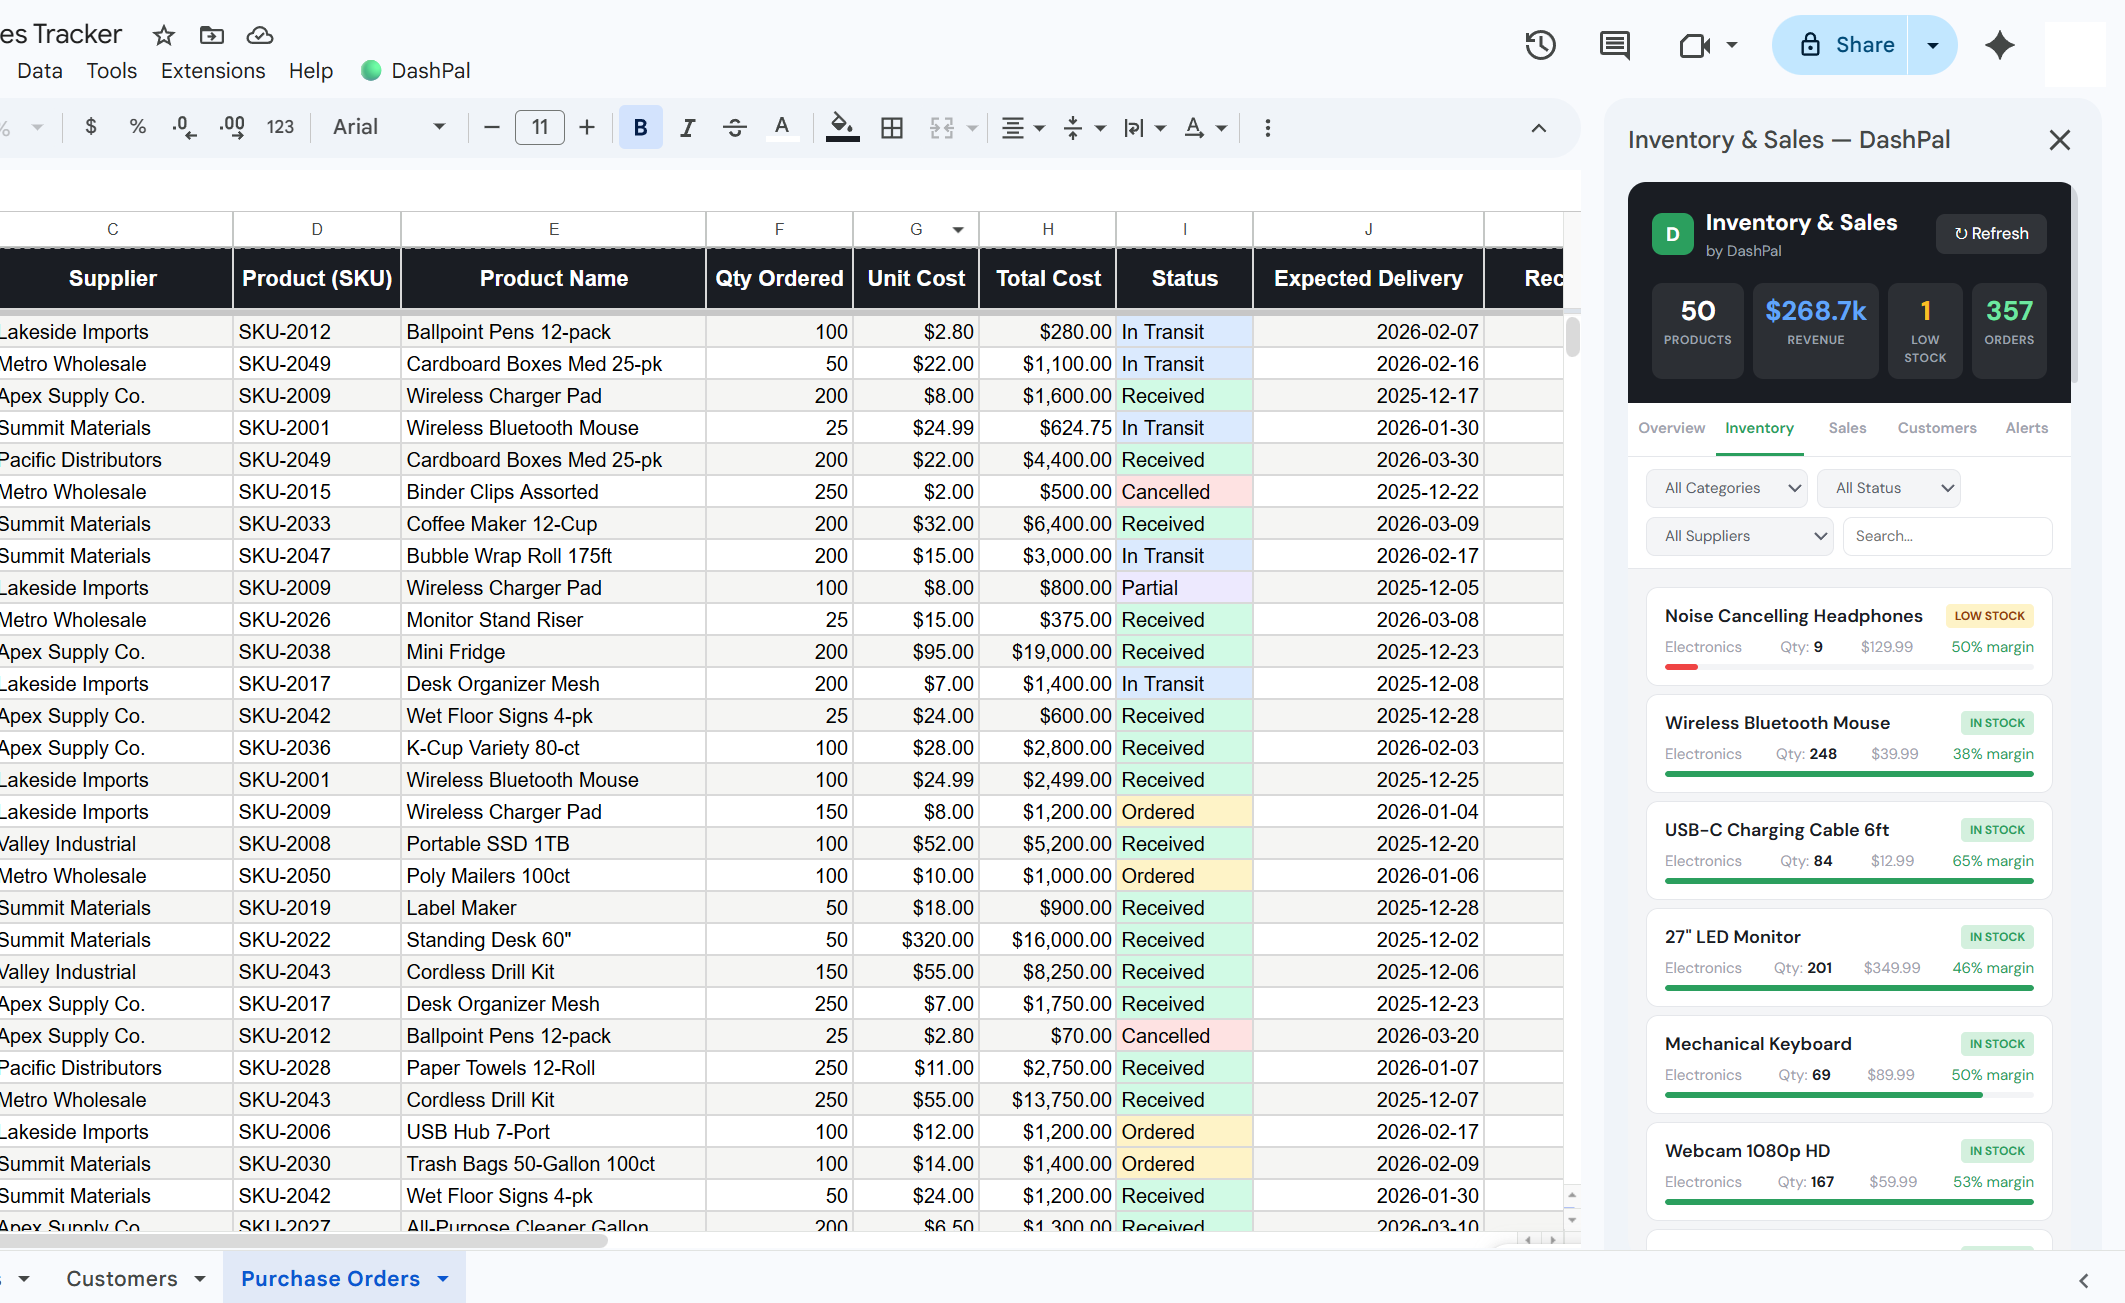
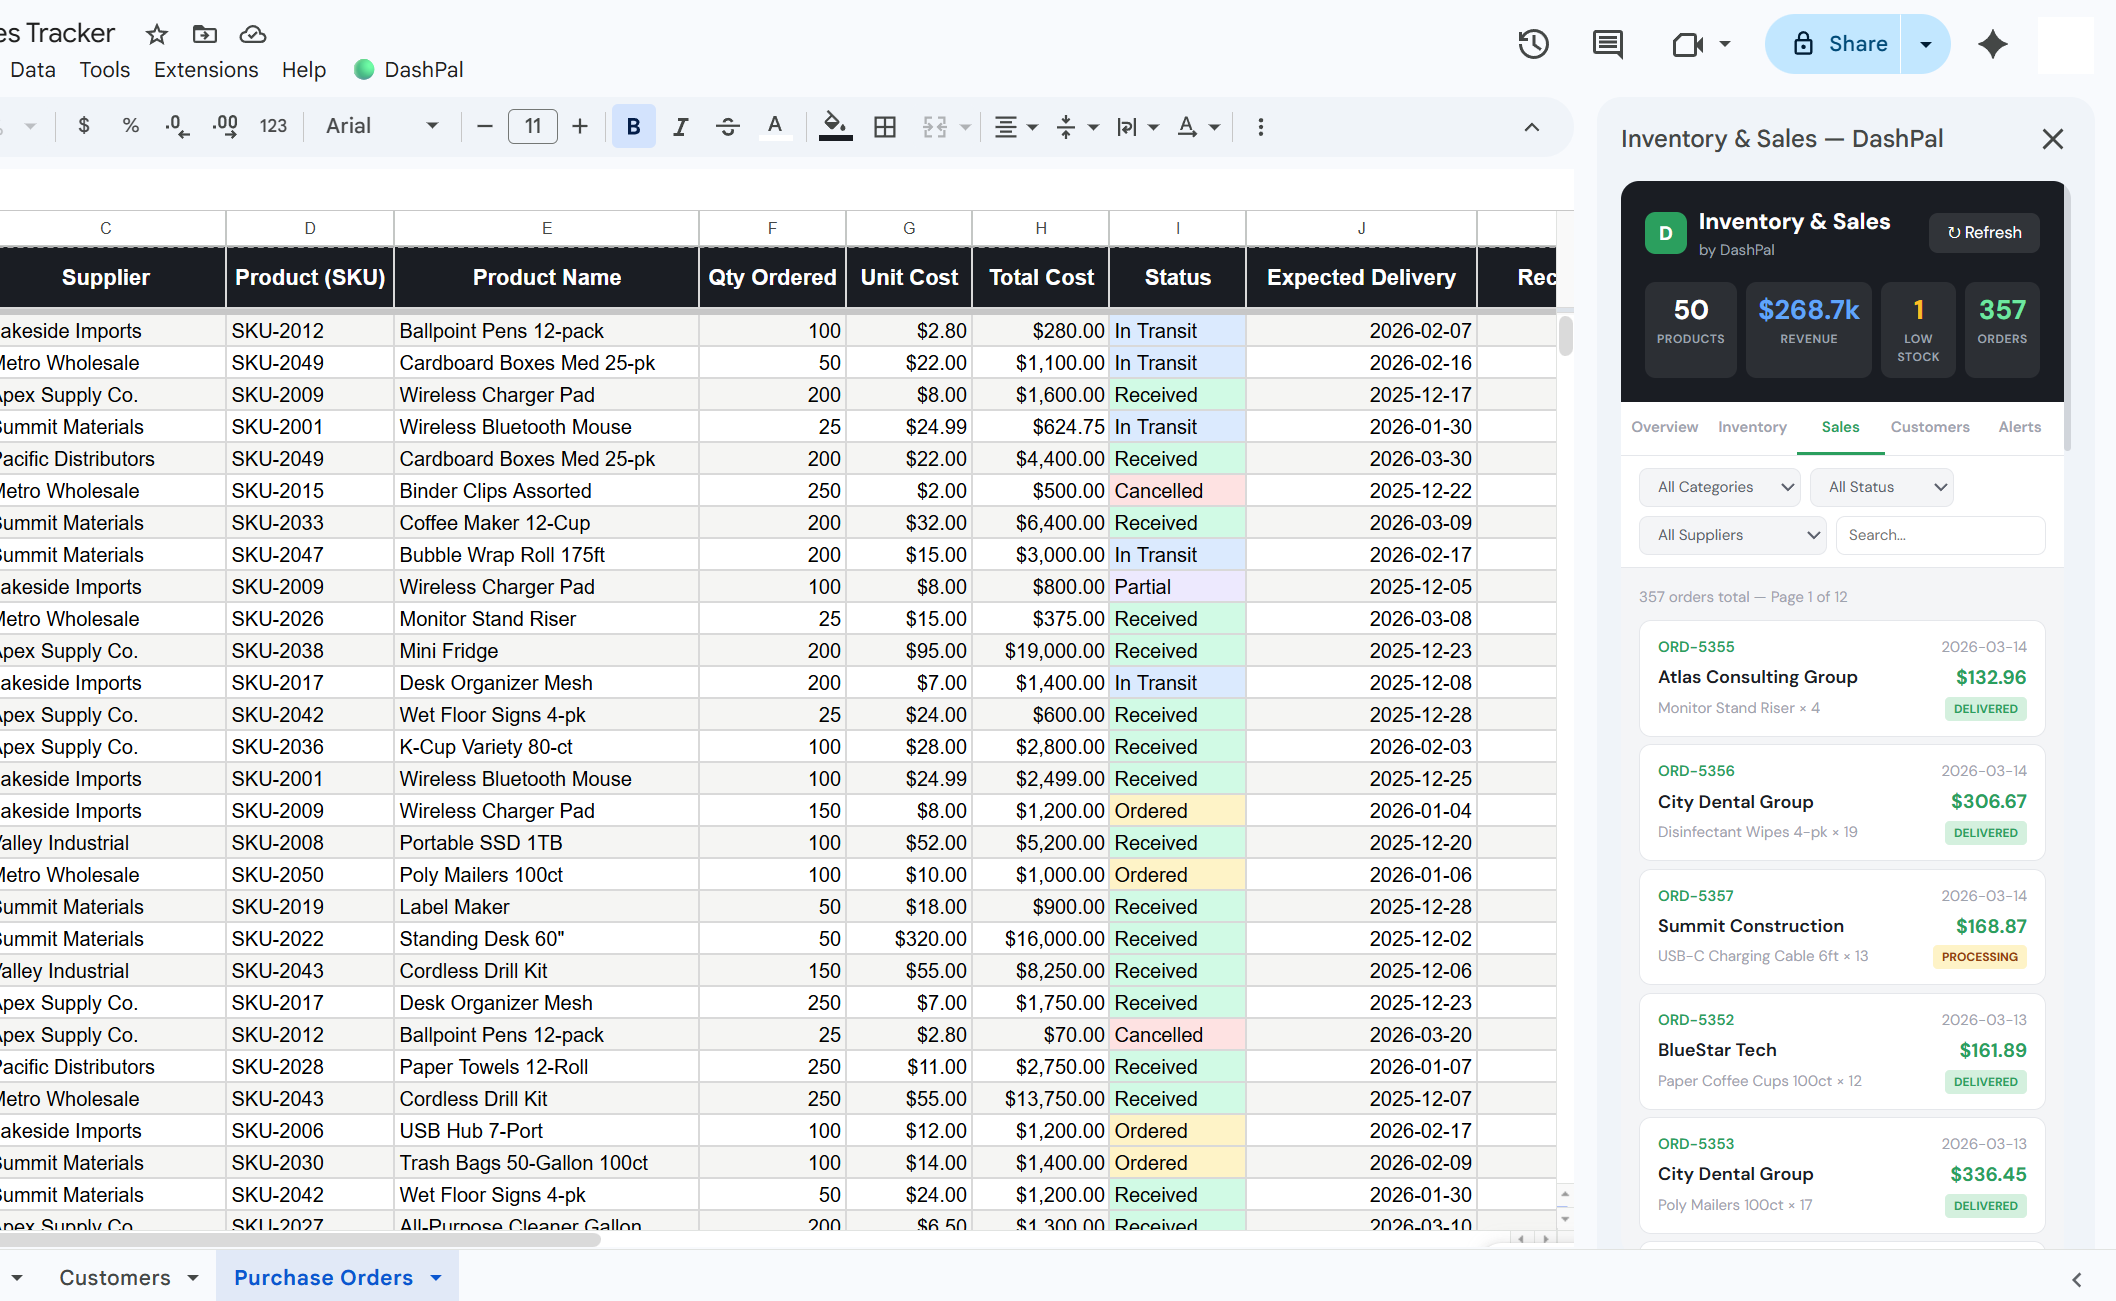
Want to see what it looked like before? Open the original raw Google Sheet this app was built on.
📋 View Raw SheetYour web app could be next
Every business has unique needs. Whether it's project tracking, inventory intelligence, financial dashboards, or something entirely different — let's build it together.
Get Your Free Consultation →